From the category archives:

Private Equity Jobs

The 2024 U.S. Deals Outlook

December 19, 2023

Fairly well-known economist John Kenneth Galbraith once quipped: “There are two kinds of forecasters: those who don’t know, and those who don’t know they don’t know.” With that acknowledged, PriceWaterhouseCoopers (PwC) recently released their 2024 deals outlook, and it has some interesting takes. Here’s a review.

Median Enterprise Value/Revenue

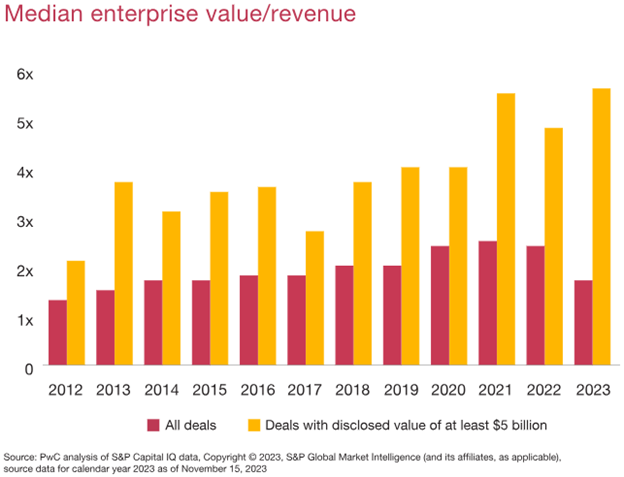
The first view from PwC is the median enterprise value per dollar of revenue. Interestingly, the median enterprise value multiplier continue growing, reaching its all-time high in 2023 for deals with a value of at least $5 billion. The deal multiple reached almost an amazing 6x!

In contrast to the large deals, for deals worth less than $5 billion, the multiple declined for the second consecutive year, likely to end 2023 around 1.5x. It reached its peak in 2021 at around 2.5x. The world is changing, and in many respects, towards the big companies and deals.

Earnings per Share Growth

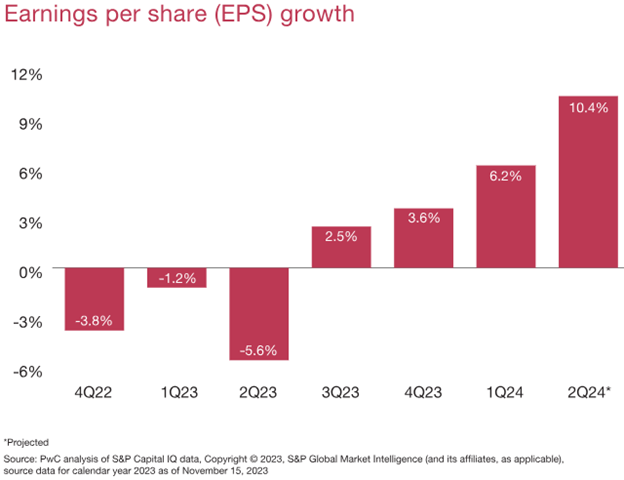
The next view is earnings per share growth. Amazingly, and perhaps way too optimistic, PwC forecasts that earnings per share will grow to 10.4% earnings growth in the second quarter of 2024. That’s a healthy figure compared to the 2.5% growth in the third quarter of 2023 and the 3.6% and 6.2% growth in the fourth quarter and first quarter of 2023/2024. Certainly, some observers think 2024 could be a banner year, regardless of the potential economic headwinds.

The View from the Technology Sector

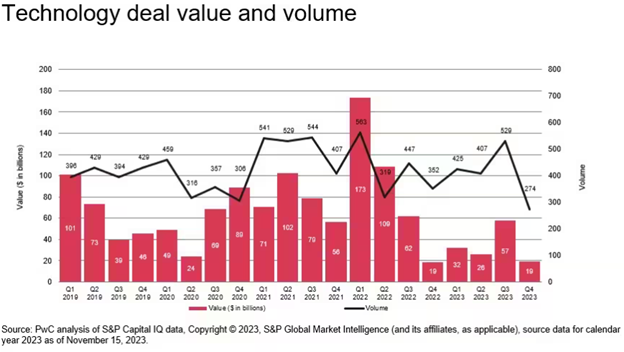
With a rosy forecast as the outlook, one might ask – what’s driving the outlook? Well, one sector that may see a rebound is the tech sector. Technology deal value and volume was weak in 2022 and 2023 overall, with deal value at a very weak value of $19 billion in the fourth quarter of 2023. The $19 billion to end 2023 was consistent with the weak picture since the fourth quarter of 2022, where deal values stood at $19, $32, $36, and $57 billion. Deal value peaked in the first quarter of 2022 at a whopping $173 billion across 563 deals.

Summing Up

Overall, looking back a year ago, most forecasters thought the 2023 year would be pretty weak. The year turned out to be much better than what most expected. The 2024 outlook also seems highly uncertain, although given the 2023 results, one might be justified in being optimistic on the deal outlook. Of course, time will tell. Wishing you Happy Holidays!

{ Comments on this entry are closed }

Looking back to March 2020, would you guess that all the major venture capital records would be broken in 2021? Amazingly, that’s exactly where the trend is heading. Here’s a look, according to investment data provider Pitchbook.

Number and Amount of Venture Capital Investment

The following has venture capital deal activity from 2011 through the second quarter of 2021. In terms of the number of deals, the number of deals is up to 7,058 – at that’s just through half of the 2021 year! The all-time high was in 2019 at 12,449. If the remainder of 2021 continues to go as the first half went, the number of venture capital deals this year will smash all prior records.

Looking at the deal value, at $150 billion through the first half of 2021, the value of deals is on course to reach $300 billion by the end of 2021. What was the prior record? Incredibly, the highest on record was 2020 at $164.3 billion in 2020. Without much possibility otherwise, the amount of venture capital investment in 2021 will smash prior records.

Source: Pitchbook

What about mega-deals?

Perhaps the most fascinating view from Pitchbook’s quarterly report is the mega-deal activity? The number and value of deals in 2021 has already surpassed prior records. Through just the first half of 2021, the number of venture capital deals is up to 385 and the value of deals is up to $85.5 billion. The prior record, which was for the entire year, as 2020 at $75.2 billion. Again, amazingly, venture capital activity in 2021 will smash prior records.

Source: Pitchbook

Crossover Activity

A third fascinating view from the Pitchbook report was the incredible growth of crossover activity in the first half of 2021. As shown below, the number of crossover deal counts through just the first half of 2021 is up to almost 300. In terms of deal value, the total deal value through the first half of 2021 has already surpassed the prior record reached in 2020 at almost $35 billion. It is nothing short of amazing what is happening in the venture capital world today.

Source: Pitchbook

Summing up

Overall, venture capital activity in 2021 will likely smash all prior records, perhaps never to be reached again. It is certainly an amazing time to be involved in the venture capital world and to be a company seeking early-stage venture capital investment. May the good times continue forever!

{ Comments on this entry are closed }

It always pays dividends to peek at updated data out of private equity data provider Pitchbook. This month’s benchmark views are no different. Here are some interesting views on private equity benchmarks according to Pitchbook’s May 6th, 2021 release.

Internal Rate of Returns by Vintage

The first view is of internal rate of returns (IRRs) by vintage year of the fund. Before looking, which year would you guess comes out on top?

Interestingly, although not surprising, the 2002 vintage year continues to exhibit the strongest IRR. Pitchbook’s most recent estimate put the 2002 median IRR value at around 16%, slightly above the 2001 value. Not far behind the 2001/2002 recession-induced investing are 2003 and 2000, with both slightly below 14%. The most recent year available – 2015 (remember, this is vintage statistics, so it makes no sense to report on years such as 2019, 2020, or 2021) – has an IRR of around 13%. Not too bad by most measures.

On the other end of the spectrum, the weak IRR years are the years in which the global economy was booming. These years include 2004 through 2010.

Source: Pitchbook

Multiples by Vintage

The next view is multiples by vintage year. Before looking, for the years from pre-1996 through 2015, which year would you guess has had the strongest multiple?

As with the prior graphic, interestingly, although not surprisingly, the year with the strongest multiple using both the pooled multiples method and the equal-weighted pooled multiples is 2001. The 2001 TVPI is 2.16x for pooled multiples and 1.99x for equally weighted pooled multiples. The 2001 results are well ahead of second place, 2002, which has exhibited multiples of 1.99x/1.83x (pooled multiples/equally weighted multiples).

What about the weakest year? So far, 2018 has the weakest measure, with its pooled multiple at 1.14x and its equally weighted multiple at 1.12x. Guess it pays to have a longer period to achieve material investing success.

Source: Pitchbook

One-Year Horizon IRRs by Selected Strategies

A third interesting view offered by Pitchbook was the one-year horizon IRRs by select strategies. Interestingly, the strongest strategy for 2020 was PE growth, with an IRR of 24.5%. Following PE growth’s lead in 2020 was venture capital at 21.3%, buyout at 17.2%, infrastructure at 5.5%, and private debt at 1.9%.

On the bottom end of the IRR spectrum for 2020 is oil & gas at -25.6%. Also in the doldrums in 2020 were secondaries at -2.4%, other PE at 1.4%, and real estate at 1.6%.

Source: Pitchbook

Summing up

Overall, the private equity industry continues to provide healthy measures of success. The future generally looks bright for professionals with a knack for private equity investing.

{ Comments on this entry are closed }

What does 2021 hold for private equity and venture capital?

December 21, 2020

Going into 2020, most analysts were predicting a healthy year for private equity (PE) and venture capital (VC). Then the pandemic hit, making observers wonder how well PE and VC would hold up in deal making and fundraising. Now that we’re entering an end to the year, it appears that most PE and VC funds […]

Read the full article →

Not a Lot of Love for the Internet of Things During the Pandemic of 2020

October 12, 2020

In March of this year, the world went into lockdown. Then, the lockdown phase began to ease. We’re now well into the economic recovery – although, for some, it may not feel that way. One industry that has received considerable investment attention in recent years is the Internet of Things (IoT). This covers things like […]

Read the full article →

5 Things the Labor Market Has Taught Us This Year

December 9, 2019

The financial industry’s success is intricately connected with the performance of the economy’s labor markets.  In 2019, the labor market taught us many things, here are five. #1 The Economy Can Boom During Trade Wars Perhaps the most surprising result of the 2019 year is the economy and its labor market can continue to boom […]

Read the full article →

Who are the Top 10 Investors in Blockchain?

March 18, 2019

Blockchain is all the rave in today’s early-stage investing world.  If you are in any way interested in the future of money or accounting or ledgers, it is impossible to avoid a discussion about blockchain. Given the popularity of blockchain, can you guess which entities are the top 10 venture capital (VC) investors in blockchain? […]

Read the full article →

2018 was a Massive Year for Buyouts

January 24, 2019

2018 was lots of things to lots of people.  Some may remember the year as the year America gained back respect from China by addressing its unfair trade practices.  Others may focus on the terrible fires in California.  Others may wish to focus on the positive, such as the amazing PyeongChang Winter Olympics.  Still others […]

Read the full article →

A Look at Pitchbook’s 2018 Startup Graveyard

October 29, 2018

In an almost interesting fashion, Pitchbook, the private equity data provider, is out with a look at the 2018 startup graveyard.  The tally reviews companies that died in the year of 2018. Before looking at the list, which companies would you guess are on the list?  Does a certain blood-testing company come to mind?  Perhaps […]

Read the full article →

Where is Financial Employment Booming?

September 17, 2018

Every now and then we review how the financial sector is doing.  Before looking, which U.S. state would you guess is #1 for financial sector employment?  Would you guess New York – the home of Wall Street?  Perhaps Chicago (Illinois), with its heavy focus on insurance services?  What about California, with its heavy focus on […]

Read the full article →
Real Time Web Analytics