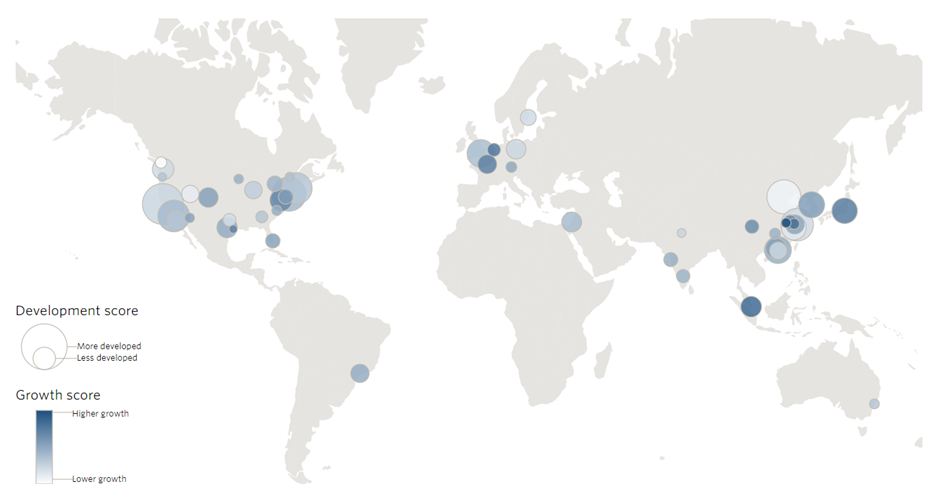
It’s a forgone conclusion that startups fare better in some cities compared to others. Private equity data provider Pitchbook is out with a new take on the world’s top startup cities. Can you guess the top 10? Here’s the geographic view.
The Top 10
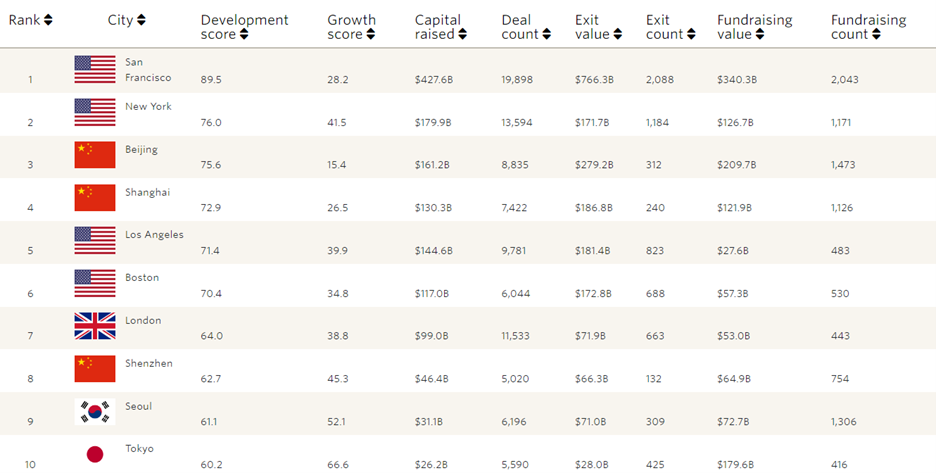
Which cities make up the top 10? Here’s the view based upon Pitchbook’s Development score. In first place is San Francisco with total amount raised of $428 billion across 19,898 deals. Businesses headquartered in San Francisco have had exit values of $766 billion across 2,088 exits.
Behind San Francisco’s lead in New York. Businesses headquartered in New York have raised $180 billion in capital across 13,594 deals.
Coming in third place Beijing with $161 billion in capital raised across 8,835 deals. Businesses headquartered in Beijing have seen a much smaller number of exits at 312, although the trend for the city is positive.
In fourth place is another Chinese city – Shanghai. Businesses headquartered in Shanghai have generated $130 billion in raised capital across 7,422 deals.
Rounding out the top five is Los Angeles with $145 billion in capital raised across 9,781 deals.
The bottom half of the top 10 includes many other well-known cities, including Boston, London, Shenzhen, Soul, and Tokyo.
Life has been good for many businesses headquartered in these cities.
Other Areas
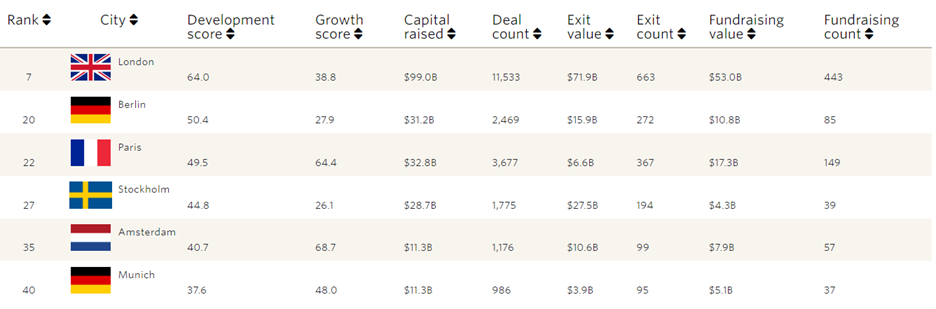
Unsurprisingly, businesses headquartered in larger cities tend to raise more capital than smaller cities. And, Americans tend to dominate the startup world, with businesses headquartered in China quickly moving to catch up. What does the top 10 look like for businesses headquartered in other areas of the world? Here’s a look at Europe.
The leading European city for startup businesses is London with $99 billion in capital raised across 11,533 deals. The next closest European city is Berlin, Germany with $31 billion in capital raised across 2,469 deals.
Behind London and Berlin are four other big European cities – Paris, Stockholm, Amsterdam, and Munich.
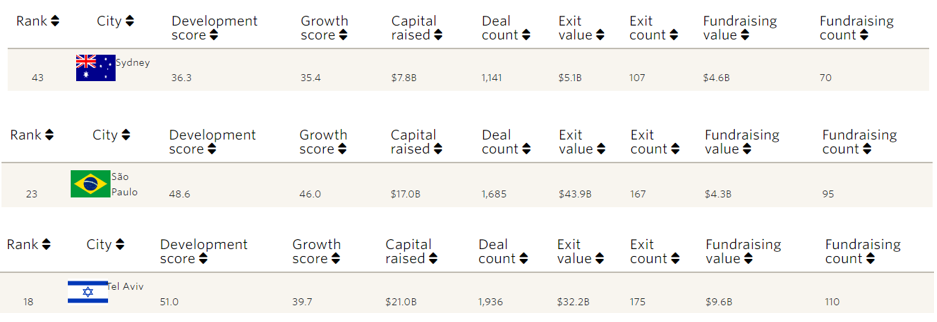
What about the Middle East, Latin America, or Oceania? According to Pitchbook’s list, three cities – one from each area – show up as top startup cities. The cities include Sydney, Sao Paulo, and Tel Aviv.
Summing Up
Overall, the startup world is much more successful in certain cities of the world. Will the current standings be similar in a decade from now? Time will tell. Many forces will affect the rankings, and we’ll see which businesses, individuals, and policymakers choose wisely for long-term economic success.
{ 0 comments }